The Contextual Fabric, Knowledge Graphs and Context Graphs
The Contextual Fabric is a living data foundation that drives knowledge graphs, decision traces and context graphs in Decision Intelligence
The Contextual Fabric, Knowledge Graphs and Context Graphs
The Contextual Fabric is a living data foundation that drives knowledge graphs, decision traces and context graphs in Decision Intelligence



Jaya Gupta and Ashu Garg of Foundation Capital on December 23rd, 2025, introduced the term "context graphs" to massive acclaim. Their paper - Context Graphs: AI’s Trillion Dollar Opportunity - describes a framework that captures “decision traces” — the actions, exceptions, precedents, and governance metadata across systems — stitched together likely with the help of AI agents in a queryable context graph. Gupta and Garg’s social media posts fuelled widespread conversation across AI and enterprise software communities.
Part of the paper’s success was it drew on recent waves of excitement around knowledge graphs to help coin the term context graphs and thus create a compelling architectural vision. While there are similarities, knowledge graphs and context graphs serve distinct purposes. Let’s break down the difference.
What is a knowledge graph?
A knowledge graph is a structured representation of facts about entities and their relationships. Think of it as a set of relationships where nodes represent entities (people, places, things) and edges represent relationships (e.g., Jaya works at Foundation Capital, LLC). Knowledge graphs are designed to capture and organize factual knowledge in a way that machines can understand and reason over. They’re also intuitive to the human eye when visually represented, though at scale are large and complex and can be computationally challenging to engage with meaningfully.
Purpose: To model real-world knowledge for search, recommendation, and reasoning.
Structure: Nodes (entities) + edges (relationships) + attributes (properties).
Example: Google’s Knowledge Graph aids search by connecting queries to real-world concepts. Quantexa’s Knowledge Graph aids identification of hidden insights in large relationship-oriented data-sets. It can highlight entity-to-entity relationships that uncover Ultimate Business Owners (UBO), legal hierarchies and sanctions evasion detection. In these instances, they provide factual insightful circumstances indicating why, for example, a Suspicious Activity Report (SAR) should be raised.
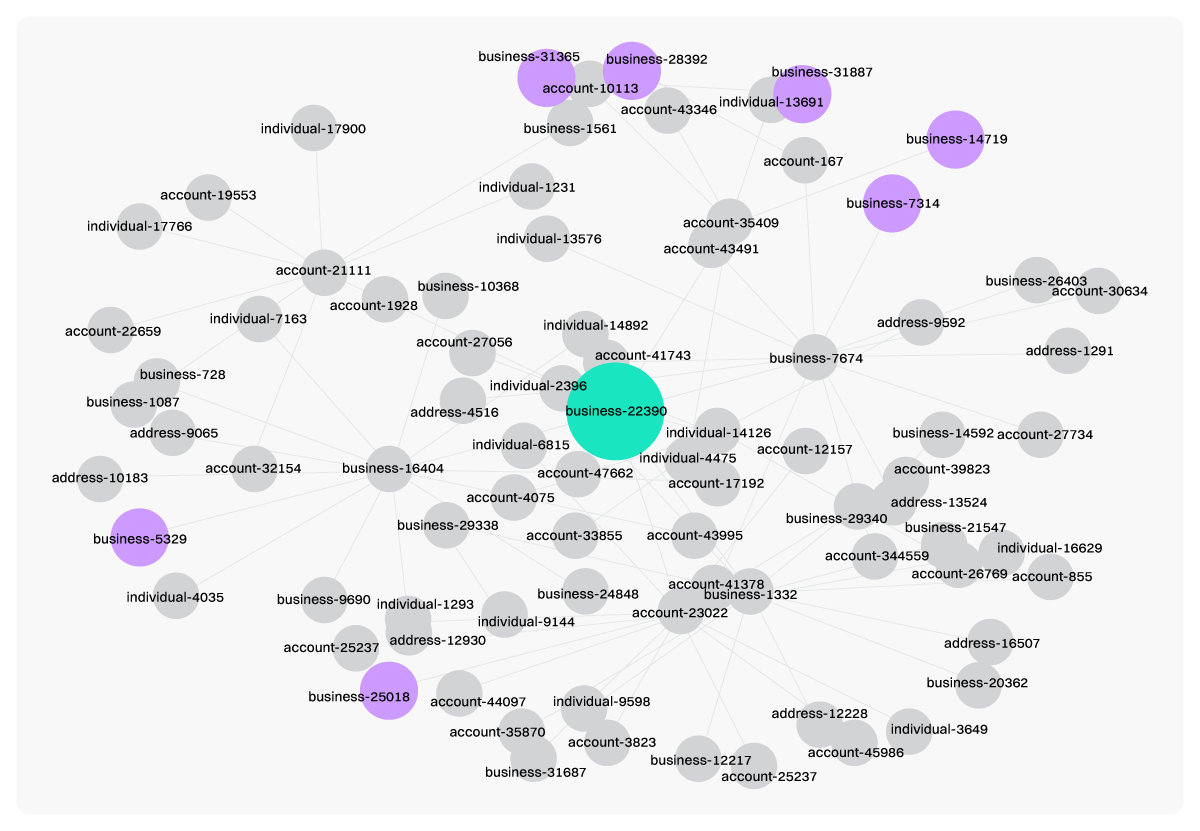
A Quantexa Knowledge Graph Perspective, here visualized with open-source Python libraries. In green, we see a high-risk business, in the context of Sanctioned Entities, connected to known entities on Watchlists (in orange). Navigating ‘multi-hop’ use cases - where insights require following several steps between related entities - is computationally and analytically challenging for many platforms including graph databases. Quantexa’s Knowledge Graph is designed to overcome this challenge.
What is a context graph?
A context graph, meanwhile, focuses on situational relevance rather than universal facts. It models the contextual relationships between entities, events, and actions over time leading up to the decision taken. Instead of asking “What is true in general?”, a context graph asks: “What is relevant to what just happened?”
Purpose: To provide dynamic, situational awareness for personalization, decision-making, or adaptive systems.
Structure: It could be similar to a knowledge graph, but it holds broader sets of information, enriched with temporal, spatial, and user-centric metadata for example.
Example: A context graph can capture the events that cause a decision to be taken, such as all the processes and actions taken to decide if and when a SAR should be created.
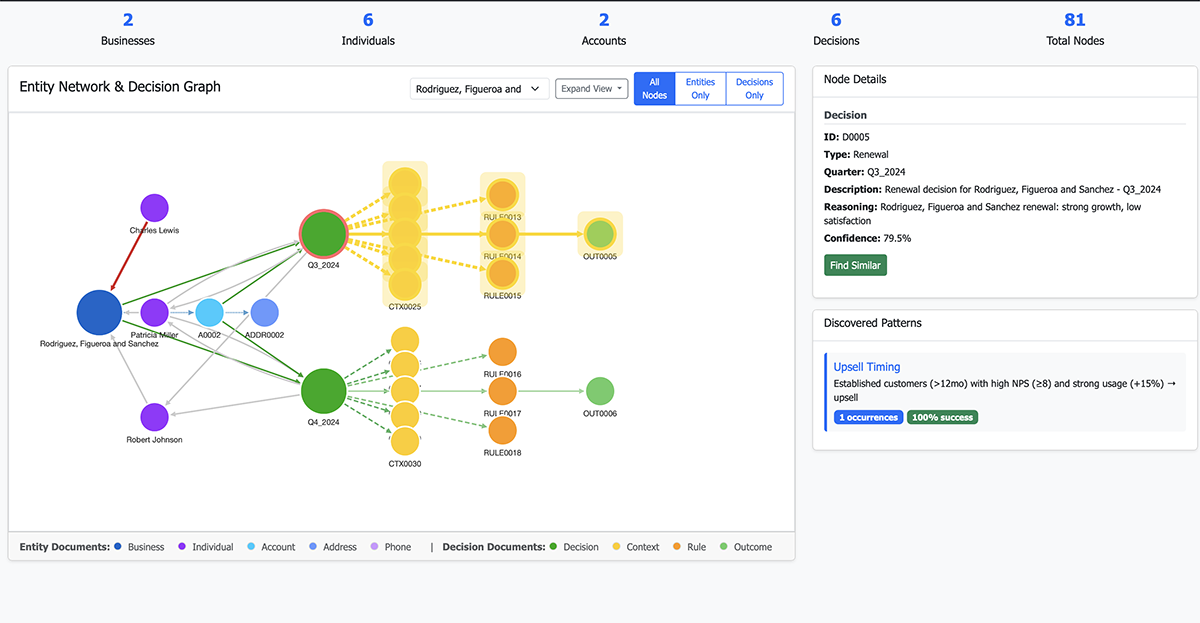 In this innovation example we use Q Knowledge Graph capabilities presented in Python via Streamlit to show the elements of decision traces elements (right-hand side) that caused a renewal event and an upsell event to happen (the two central large green circles). On the left hand side is the traditional knowledge graph, the relationships between the key subject entities related to the opportunity. The result is a combination of knowledge graph and context graph.
Key Differences
Feature | Knowledge Graph | Context Graph |
Focus | Universal facts | Situational decision relevance |
Static or dynamic? | Mostly static, updated periodically | Dynamic, temporal, changes with context, historical replay |
Data Sources | Encyclopedic, from structured and unstructured data sources (a graph database is not required) | Point-in-time signals per Gupta & Garg, usually captured via agents, but also through user interactions. |
As AI systems evolve, knowledge graphs provide a backbone of factual understanding, while context graphs offer supporting adaptive intelligence to the process.
Is a context graph an oxymoron?
A critique of the context graph nomenclature is that graphs of all types contain context. It is like “saying 'time clock' or 'heat microwave'.” Other criticisms too have been offered. Recent commentary after Gupta and Garg’s blog highlights that the aggregation of decision traces need not be a graph with nodes and edges, but could be presented, for example, as an event-based state machine, or as a temporal decision log. The notion of ‘replay’ in the context graph thesis through, for example, bi-temporality is also familiar to those working capital markets, where the situations that caused a trade get replayed for internal (trade improvement) or external (regulator suspicion) purposes.
Beyond the ambiguity of the context graph terminology, its presentation and computation, the article addresses key points relevant to decisioning processes. For example:
Teams and organizations can focus on organizing good decision processes but can miss out on the mechanics that cause “decisions” (policies, rules) to happen.
The concept of decision traces is powerful. It captures the elements of how a team or an organization makes a decision. That can include technical enablers – a score or an alert – which triggers action, or functional enablers – a purchase approval in a system, or the override of a lending decision.
Agentic capture of decision traces help and hinder. On one hand, they offer a scalable means to automate mundane activities. On the other, systems of agents present risk around consistency of interpretation which is a big deal. They must be used responsibly.
The ability to look back at and replay decisions can complement forward looking decision planning, preparations, modelling and ex-post analysis is powerful.
In short, while the context graph nomenclature can feel confusing and limiting – representing decision-making processes entails more than just a graph - the discussion around recording decision traces is tremendously helpful.
From knowledge graphs to decisions: The role of a Contextual Fabric
With this in mind, Quantexa has long advocated the concept of a Contextual Fabric as the foundation for effective Decision Intelligence. The Contextual Fabric describes a dynamic approach to organising data around entities, relationships, and context, providing a way to align knowledge graphs with the realities of decision-making in complex organisations.
Rather than viewing decisions as isolated outputs, the Contextual Fabric frames them as contextual artefacts shaped by entities, events, and circumstances before, during, and after they occur. In doing so, it can provide a conceptual model for how organisations could progressively connect entity-resolved knowledge graphs with decision traces and outcomes across their data estate.
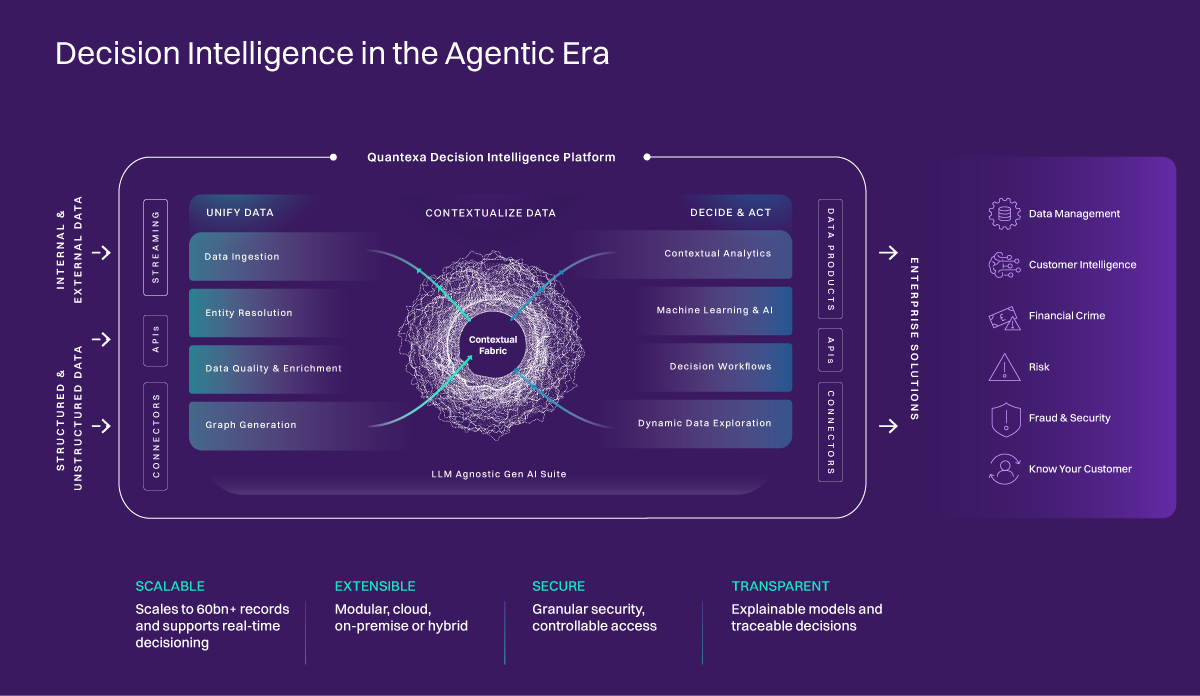
Furthermore, the Contextual Fabric is tangible and operational at many of the world’s leading organizations, proven to deliver Decision Intelligence with significant business value.