Anti-Money Laundering
Reduce false positives. Automate and augment investigations and visualize hidden connections. Lower the cost of compliance with more confidence in your coverage.
Request a demoMonitor, detect, and investigate real risk
Traditional transaction monitoring systems can’t generate a holistic view of risk. To power the right detection mechanisms, surface hidden risks, and enable efficient investigations, you need a full picture of your customers and their counterparties.
HOW WE SOLVE IT
More accurate monitoring, detection, and investigations

Eliminate data silos for good
Reduce manual data gathering by connecting internal and external datasets to generate a 360-degree single view of your customers and related entities.

Uncover hidden risk in networks
Add context to gain a clearer understanding of customers and counterparties in real time and identify risk beyond a single transaction.

Monitor and detect proactively
Improve financial crime monitoring with Contextual Monitoring to generate fewer, more accurate alerts across various AML types.

Empower intelligence-led investigations
Visualize hidden connections, turn data into intelligence, and detect risk faster by automating and augmenting investigations.
THE IMPACT
What we have achieved
in false positives
between bank customers and external data
in investigation time (at scale)
See it in action
Take a self-guided tour to see our platform in action. Follow the prompts to uncover how you can quickly and easily uncover complex money laundering threats.
We help you bring context to AML compliance
WHERE WE HELP
Our AML and investigations solutions

Intelligence-Led Investigations
Automate L1 investigations and augment L2, L3, L3+ and FIU investigations with our integrated investigation platform.

Markets AML
Identify and understand risks from trades to settlement, incorporating other controls into a holistic framework across asset classes.

Government FIU
Integrate internal and external data in real time to triage and support Financial Intelligence Unit (FIU) investigations.

Correspondent Banking AML
Identify and understand the risk of your customers’ customers, how they flow money through the banks, and how KYCC enhances the ability to monitor your respondent banks.

Trade AML
Identify and understand the risk of non-customers and counterparties and automate manual controls to better detect Trade Finance AML and fraud pre- and post-trade.

Retail AML
Enrich context and transform your approach to risk detection, optimization and investigations of retail customers through AI-driven capabilities and correlated typologies.
Get an overview of our Contextual Monitoring solution
category-leading technology
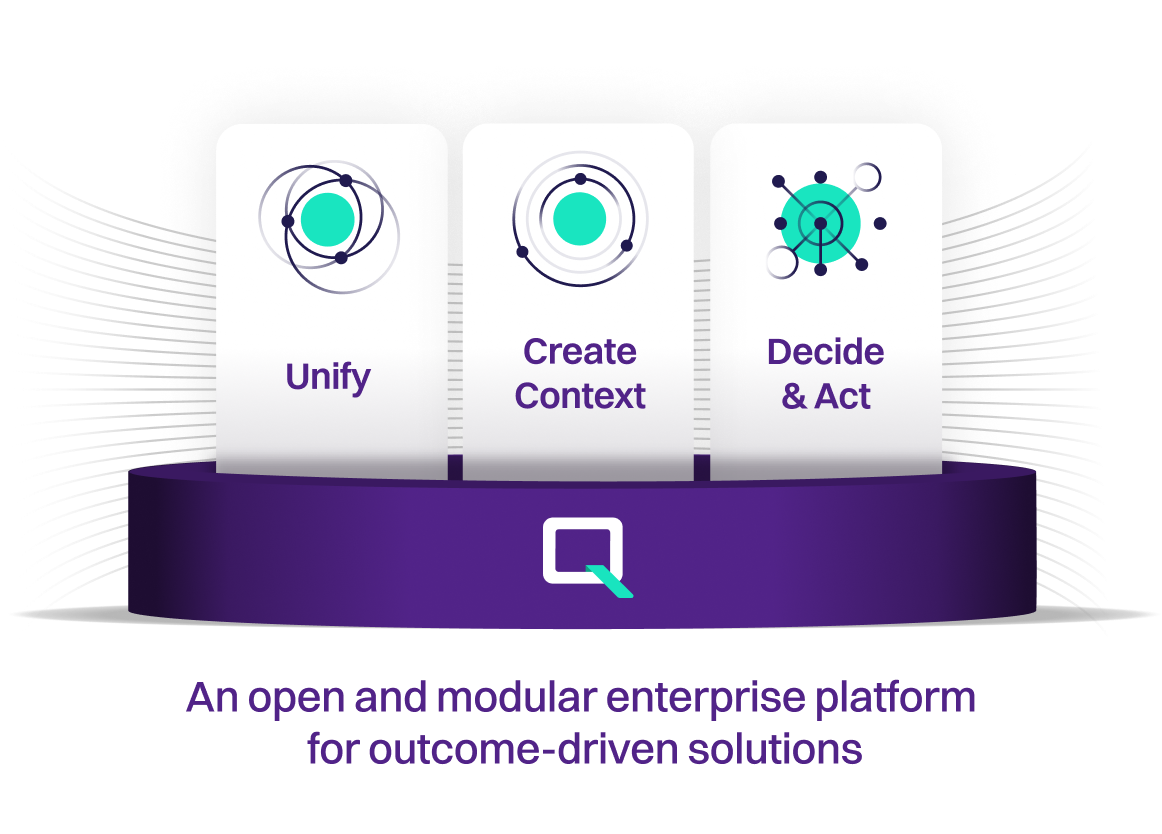
Our Decision Intelligence Platform
Build a single view of data and create a culture of confidence around critical decision-making that protects, optimizes, and grows your organization.

Decision Intelligence solutions built on our platform
Data Management
Build a trusted data foundation to deliver context for decision-making.
Learn moreCustomer Intelligence
Enhance customer experience and accelerate revenue growth with a 360-degree connected view of customers.
Learn moreKnow Your Customer
Detect risk in real time to identify unknown risks and deliver more accurate risk ratings.
Learn moreRisk Management
Revolutionize risk assessment with a holistic understanding of borrowers, their counterparties and relationships.
Learn moreFraud and Security
Uncover hidden fraud risks with a contextual approach to detection and prevention.
Learn moreFinancial Crime
Reduce false positives and focus on real risk by modernizing your AML monitoring, detection, and investigation.
Learn moreFAQs
What is the difference between traditional Transaction Monitoring and Contextual Monitoring? 
Rules-based transaction monitoring systems have several limitations and challenges, which have historically hindered their effectiveness in detecting and preventing financial crimes.
For example, the rules and thresholds need to be manually created and updated, making the system less adaptable to evolving and emerging threats. Similarly, rules-based systems also typically analyze individual transactions in isolation and may not provide a comprehensive view of customer and counterparty behavior or relationships. They may miss the connections between seemingly unrelated transactions or accounts, which can be crucial in identifying more complex fraud networks or money laundering schemes.
In contrast, by combining multiple internal and external datasets all at once, Contextual Monitoring transforms the view of risk to a gain clearer understanding of customers, counterparties, their relationships, and behaviors in real time. Using advanced Entity Resolution and network generation techniques, Contextual Monitoring focuses on holistic relationships rather than transaction risk in isolation.
This added context helps to identify hidden risk and generates fewer, more accurate alerts. Institutions can reduce rising compliance and operational costs and conduct more effective and efficient intelligence-driven risk processes without replacing existing systems.
How can we accelerate the investigations process?
Turning data into intelligence is imperative for reducing manual processes, identifying critical connections and breaking down silos between teams. For AML investigations, shifting to an intelligence-led approach goes beyond a single event, relationship or activity enabling a more holistic understanding of customers, employees, counterparties and their related risk. With the broad capabilities of Quantexa’s platform, intelligence officers have a powerful tool that can run different analytical tasks, covering a risk-based approach and integrating third-party data and external sources for deeper investigation. Unlike traditional systems, Quantexa's AML software visualizes hidden connections through additional context.
How can banks navigate AML complexities?
Evolving AML intricacies and typologies driven by multiple channels, lines of business and products have driven major challenges in financial services. With Quantexa's Decision Intelligence platform, Quantexa's AML software can transform a banks approach to financial crime compliance. Improving risk coverage, identifying complex typologies, pinpointing real risk, reducing false positive and uplifting efficiencies.
Latest from Quantexa
DRIVE INDUSTRY TRANSFORMATION
Speak to an expert
Protect, optimize, and grow your organization with Decision Intelligence. More is possible with the right data in the right context.


